

Raw Snapshot of Knowledge-Based Economy
Foreign trade indices issued by the Custom Service of State Revenue Committee will be touched upon in this article, as promised. This time names of exported products, volumes, price and directions will be covered.
First and foremost, it’s worth mentioning, that according to data of RA National Statistical Service (NSS) total volume comprised USD 1 billion 486 million 886.1 thousand in 2015. Customs Service separately issues the list of products, with high customs value, exported from Armenia. The list includes 32 product names, total of which comprised USD 1 billion 313.8 million in 2015. This makes about 88% of our total export volume.
Significantly enough, upon RA NSS data, export volume from Armenia decreased by 3.9% in 2015, as compared to 2014. And 0.4% growth has been recorded in terms of 32 most important products included in the list. Prices for 22 products out of 32 recorded fall throughout the previous year. It’s revealed from the comparison of customs values and physical volume of those products. For instance, export of Armenia’s most crucial product—copper, pursuant the Customs Service data, was depreciated by about 20%. Price per ton of copper (ore and concentrate) exported from Armenia in 2014 comprised USD 1274.4, and according to 2015 data, it has decreased by USD 250, thus, comprising USD 1024,1.
To make its effect clear, it needs to be clarified a little. 309.2 tons of copper have been exported from Armenia in 2015 (ore and concentrate), customs value of which comprised USD 316.6. If prices for copper didn’t drop and at least remained on the level of 2014, export of the same volume would comprise USD 390.4 million. This means, drop in prices for copper only in this direction reduces Armenia’s export revenues by about USD 74 million. Upon our calculations, if prices for the 32 products didn’t drop (and exported in 2015 by prices in 2014), export volume would comprise USD 1 billion 560 million.
It’s worth touching upon geography as well. The biggest buyer of Armenian coper is China (USD 138.9 million or 43.9%), and the second biggest market is Bulgaria (USD 78.5 million or 24.8%). For this purpose, while reading about downside of China’s economic growth, one shouldn’t think it’s too far from us and doesn’t refer to us. It rather precisely affects money coming into our country. Cigarettes are worth particular attention, in their good sense. Export of cigarettes from Armenia in 2015 recorded a sharp growth, more than by 50%, and became the second crucial direction after copper. According to Customs Service data, it’s being exported to 9 countries. Iraq is the biggest consumer of Armenian cigarette, volume of which comprises 73.8% (about USD 126.2 million). Syria is an important market as well—USD 25.3 million.
Third place of Armenia’s export belongs to strong alcoholic beverages (80% alcohol by volume). Here, it first and foremost, refers to brandy. In this direction, both price and physical volume have gone down. 11.9 million liters of alcoholic drink have been exported in 2015 by USD 105.8 million customs value (last year—13 million liters, comprising USD 164.9 million). Main export direction here is Russia—USD 79.9 million (75.5% of total). Besides Russia, strong alcoholic beverages are exported to more than dozen countries. Note, products with USD 2.8 million total cost have been consumed in Iraq (details aren’t provided in the statistics for 2014 ; in case of Iraq, to all possibilities, it refers whisky).
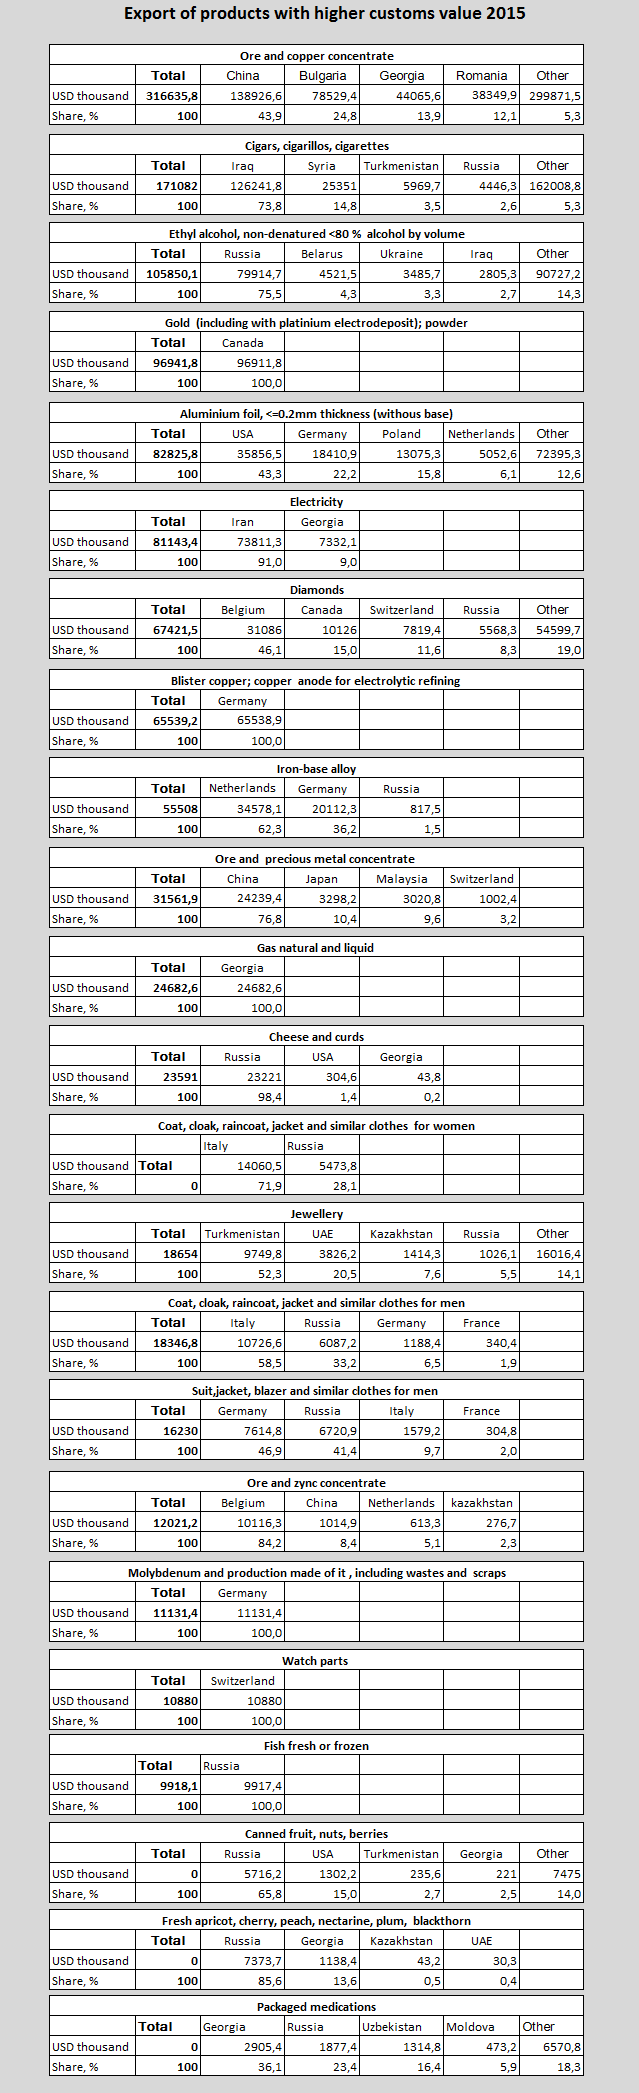
Charter has been made by coordination of customs data, showing the product and the country it was exported. On the whole, it’s clear, that metals ae exported to China and European countries (Germany, Netherlands). Food is mainly exported to Russia. Gold is exported only to Canada, and jewelry—to Turkmenistan, UAE and etc. Medication is mainly exported to Georgia, clothes –to Italy and Germany, electricity—to Iran and Georgia.
Surely, this is curious from the perspective of general awareness. However, main purpose of introducing these data is revealing weak structure of our export (or reminding it). Only 4 product names (copper, cigarettes, brandy and gold) comprise more than half of total volume of Armenia’s export. More than USD 600 million comprise metals in different forms (ore, concentrate, waste, scraps) and etc. Greater specific gravity comprise food and beverages. Accordingly, this speaks not only of the export being non-diversified: we mainly export raw materials and food. It’s rather disappointing, when amongst the 32 exported crucial products, pretending for being knowledge-based, only one refers high technologies—special purpose motor vehicles, just 7 units, with AMD 4.6 total amount. By the way, while working out customs data, we decided to also check what we export to Singapore.
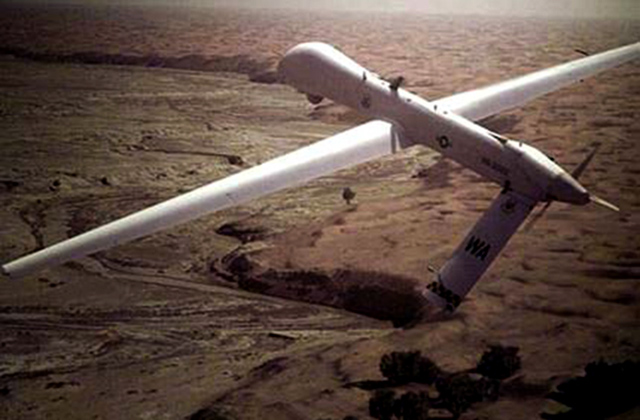
It’s not a secret that throughout the four-day war, when the topic of unmanned aerial vehicles (UAV) was being circulated, some stated that UAVs produced in Armenia are supplied to Singapore. Based on customs data, export volume from Armenia to Singapore in 2015 comprises ony USD 400.7 thousand, from which USD 347.3 thousand belongs to watches and USD 35 thousand—to fruits, nuts and beverages, and USD 14.4 thousand—to devices and models for demonstration purposes (not suitable for other purposes). Data neither for 2015 nor for 2014 contain UAV or similar equipment product names.
By Babken Tunyan