

How do Armenians earn and spend their finances?

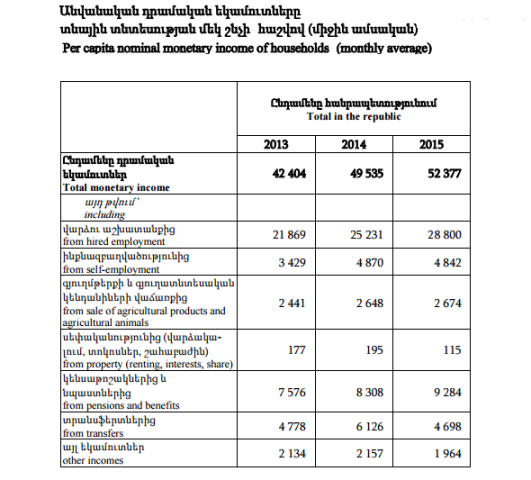
Main source of income for households of the Republic of Armenia is hired job. Thus, monthly nominal monetary income of households in 2015 per capita comprised AMD 52377, from which AMD 28800 (55%) comprises hired job. This information was provided by RA National Statistical Service through its report entitled “Food security and poverty 2016.”
The second large source for monetary income are pensions and benefits (AMD 9285 or 17.7%), and the third one—self-employment (AMD 4842 or 9.2%).
Incomes from money transfers from abroad are the forth (AMD 4698), instead of the third for 2014, which is conditioned by considerable reduction in transfer inflow.
Besides transfers in 2015 incomes from property have sharply reduced (rent, interests, dividend). Average monthly nominal income from that source comprised AMD 195 per capita in 2014, and in 2015—AMD 115. This indirectly edifies on decrease of economic activity level.
Monetary incomes between urban and rural areas, naturally, are different. Average monthly nominal income per capita comprised AMD 58607, and in rural areas—AMD 42103.
However, the difference isn’t only between urban and rural areas. Official statistics represents that of incomes as well: by 10 decile groups (from the first group with the least income to the 10th group with most income).
The snapshot for 2015 is the following: in the most provided group of population average monthly income per capita comprised AMD 168.6 thousand, and in the first—socially most vulnerable group—around AMD 10.3 thousand.
Thus, income of 10 wealthiest households is 16.37 times more than the income of 10% poorest population. This speaks of the deep polarization of incomes.
Moreover, as compared to 2014, this polarization has weakened a bit (in 2014 that index was 16.37 times more). However, as compared to 2013, income difference has considerably increased: in 2013 monthly income for the wealthiest group per capita (AMD 130.6) was 15.4 times more than the most vulnerable group.
This is much for incomes. How about volume and structure of the population’s expenditures?
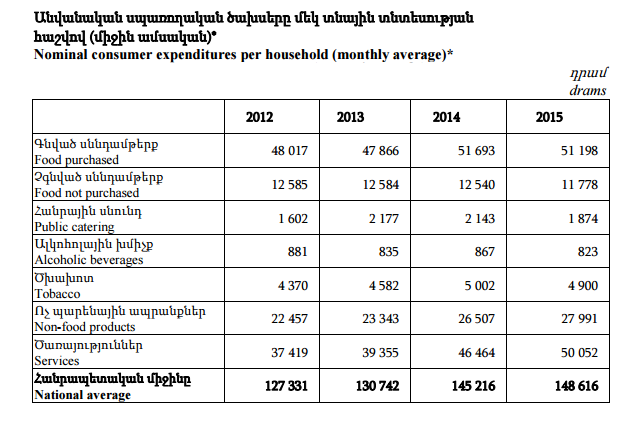
According to the official statistics, average monthly nominal expenditures in 2015 comprised AMD 148616. As compared to 2014 monthly expenditures increased by AMD 3400 or 2.3%.
Main direction of consumption is food. 42.3% of monthly expenditures of the population are shared by food in 2015, from which: AMD 51198 was directed to purchased food or 34.4%, and expenditures regarding non-purchased food comprised AMD 11778 or 7.9%.
The third direction of households’ expenditures is services. In the period of 2015 households directed AMD 50052 monthly to service purchase, which comprises 33.7% of total expenditures.
AMD 27991 was directed to purchase of non-food products (18.8%). 3.3% (AMD 4900) of monthly expenditures is shared by cigarette purchase, and 1.3% (AMD 1874)—to public food.
Households spend AMD 823 per month on alcoholic beverages, which comprises 0.6% of total expenditures.
To end the publication with somewhat joyous note, it should be stated that expenditures made for alcoholic beverages in the period of recent years have reduced (in 2012 that index comprised AMD 881).
By Babken Tunyan